Beyond the Limits of Standard BI Tools
Many organizations eventually run into barriers with tools like Power BI. Whether it’s strict visual templates, limited customization, performance constraints, or the need for complex interactions that the platform simply wasn’t designed to support.
When Power BI or other off-the-shelf analytics tools can’t achieve what you need, MOST Programming steps in.
We build bespoke dashboards and custom visual components that go far beyond the capabilities of standard BI platforms, giving you full control over design, interactivity, performance, and data behavior.
Interactive Data Visualization & Custom Dashboards
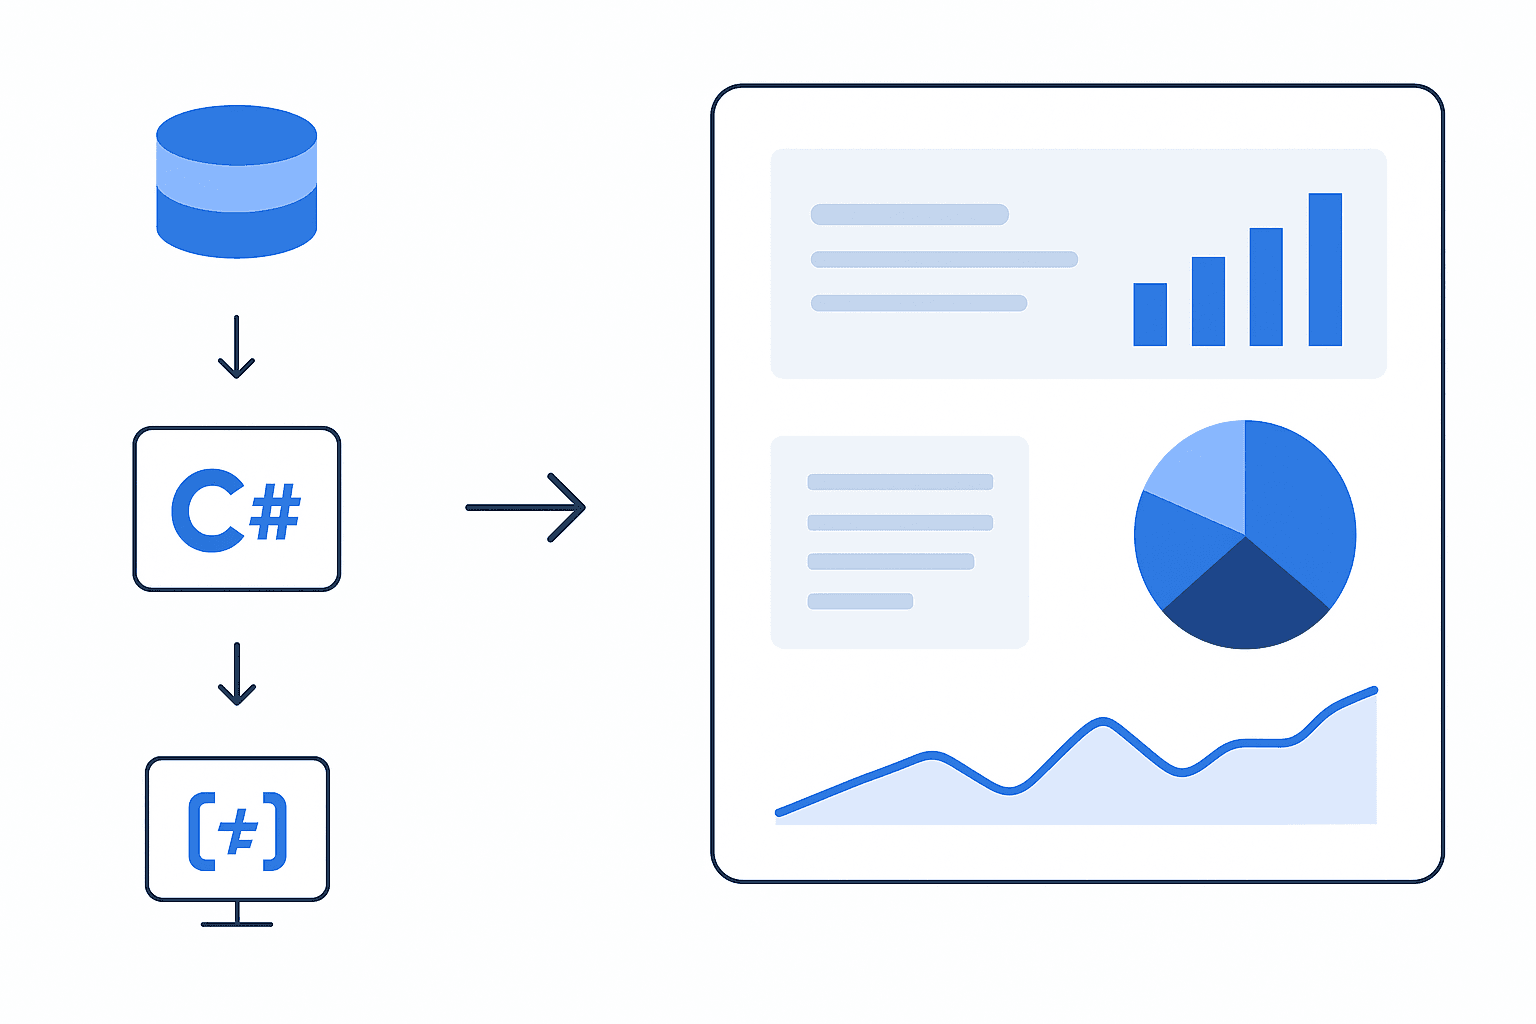
At MOST Programming, we transform raw data into dynamic, intuitive dashboards that empower businesses to make fast, confident decisions. By combining C# backend development with Highcharts, one of the industry’s leading JavaScript visualization frameworks, we deliver fully customized, interactive visualizations tailored to your organization’s KPIs, workflows, and data sources.
What We Build
- Custom Business Dashboards
Fully interactive dashboards that bring together charts, metrics, and reports in one centralized interface. Users can filter, drill down, explore trends, and export insights instantly. - Highcharts-Based Visualizations
From line and bar charts to heatmaps, geographic maps, and advanced multi-series visuals, we design highly responsive charts with smooth animations, tooltips, zooming, and custom styling that precisely match your brand. - C#-Powered Data Integration
Using C# and .NET, we connect to SQL databases, cloud APIs, internal systems, and large datasets to clean, standardize, and securely deliver data to your dashboards in real time. - Secure, Scalable Architecture
Role-based access, encrypted endpoints, and scalable backend pipelines ensure your dashboards remain fast, reliable, and enterprise-ready at any scale.
How It Works
- Data Sources
Databases • Cloud APIs • Legacy systems • Event logs - C# / .NET Backend
Extracts, transforms, aggregates, and validates data - REST API or JSON Feed
Secure, high-performance delivery of structured datasets - Highcharts Visualization Layer
Renders interactive charts, maps, and dashboards in the browser - User Dashboard Experience
Filters • Drilldowns • KPIs • Exports • Real-time updates
Custom Dashboard Development Services: Transform Your Business Data into Actionable Insights
Introduction
Custom dashboard development is the process of building tailored data visualization platforms that aggregate business data from multiple sources into unified, interactive interfaces designed specifically for your organization’s unique requirements. Unlike generic tools or pre-built templates, custom dashboard solutions align precisely with your business processes, data ecosystems, and decision-making workflows.
This guide covers the complete landscape of custom dashboard development—from understanding core components and dashboard types to navigating the development process and solving common implementation challenges. Topics outside this scope include basic spreadsheet reporting, standard off-the-shelf BI tool configuration, and general data science methodologies. The target audience includes IT directors, business analysts, and organizational leaders at mid-size to large enterprises who need to modernize their data infrastructure, consolidate reporting systems, and replace legacy Excel-based analytics with dynamic business intelligence platforms. We also introduce business dashboard development services—a comprehensive suite that includes custom dashboard creation, process optimization, data integration, and visualization tailored to specific business needs.
Direct answer: Custom dashboard development creates bespoke data visualization platforms that pull data from your existing systems—CRMs, ERPs, databases, and APIs—into real-time, interactive displays that transform raw data into actionable insights tailored to specific business objectives and user roles. Custom dashboard development solutions are tailored, scalable, and flexible services designed to meet specific business needs across various industries.
By reading this guide, you will:
- Understand the complete custom dashboard development process from discovery to deployment
- Identify which dashboard types align with your organizational needs
- Learn implementation best practices for successful dashboard integration
- Recognize and avoid common pitfalls that derail dashboard projects
- Gain a framework for planning and executing your own dashboard initiative, including how to adapt dashboards to evolving business requirements and strategies
Understanding Custom Dashboard Development
Custom dashboard development is the systematic process of creating bespoke data visualization platforms tailored to specific business requirements, data sources, and user workflows. This approach differs fundamentally from deploying pre-configured templates by delivering solutions that match your exact organizational structure, key performance indicators, and decision-making patterns. Data dashboards are interactive visual tools that display and analyze data in real-time, supporting decision-making and enhancing user engagement.
Modern businesses struggle with fragmented data landscapes—customer information in one CRM, financial data in another ERP, marketing metrics across various platforms, and operational statistics scattered throughout legacy systems. Custom dashboards solve this by creating a unified layer that connects these disparate sources, allowing users to access insights without navigating multiple applications or manually consolidating spreadsheets. Custom dashboards improve business processes by providing real-time insights, automating data collection, and supporting better decision-making for enhanced operational efficiency.
Core Components of Custom Dashboards
Every effective custom dashboard consists of interconnected layers working together to deliver meaningful business intelligence. The key features that differentiate custom dashboards include real-time data sync, role-based access, predictive analytics, and multi-source integration, providing users with advanced functionalities tailored to their needs:
Data integration layer: This foundation connects your existing systems—Salesforce, HubSpot, SAP, Oracle, SQL databases, and cloud platforms—through REST APIs, GraphQL endpoints, or direct database connections. ETL processes cleanse, transform, and standardize raw data before it reaches visualization components.
Real-time processing engines: Beyond static reporting, modern dashboards track real time data through streaming connections, scheduled refreshes, or event-driven updates. This enables teams to monitor critical metrics as conditions change rather than reviewing historical data hours or days later.
Interactive visualization interface: Charts, graphs, gauges, heatmaps, and KPI displays transform numerical data into comprehensible visual formats. Customizable widgets, drill-down capabilities, filters, and intuitive navigation allow users to explore key data from high-level summaries to granular details.
User access controls: Role-based permissions ensure teams see relevant information appropriate to their responsibilities. Executives access strategic overviews while operational teams view department-specific metrics, all with proper data security protections.
These components create comprehensive business dashboard development solutions that adapt to how your organization actually operates rather than forcing workflow changes to accommodate software limitations.
Custom vs. Off-the-Shelf Dashboard Solutions
Pre-built dashboard tools like Power BI templates or Tableau public dashboards offer quick deployment and lower initial costs. They excel when requirements align with standard use cases and data structures.
Custom dashboard development becomes necessary when:
- Your data environment involves complex integrations across legacy systems and modern platforms
- Industry-specific requirements demand unique business logic and compliance features
- User experience needs extend beyond template capabilities
- Long-term scalability requires purpose-built architecture
- Competitive advantage depends on proprietary analytics and insights
The trade-off involves higher upfront investment in custom development versus ongoing constraints with generic tools. Organizations with 50+ users, multiple data sources, or specialized industry requirements typically find custom solutions deliver superior ROI through improved adoption and more relevant actionable intelligence.
Understanding these foundational differences prepares you to evaluate specific dashboard applications suited to various organizational functions.
Benefits of Custom Dashboards
Custom dashboards deliver significant advantages for organizations seeking to harness the full potential of their business data. By consolidating key performance indicators (KPIs) and critical metrics from multiple sources into a single, intuitive interface, custom dashboards provide enhanced visibility across all levels of the business. This centralized approach empowers decision-makers to monitor relevant information in real time, quickly identify trends, and respond proactively to emerging opportunities or challenges.
With custom dashboard development services, businesses can create dashboards tailored to the unique needs of each department or team. This ensures that every user has access to the most pertinent data, supporting more informed decision-making and driving continuous improvement in business processes. Integration with existing systems further streamlines operations, eliminating data silos and reducing manual reporting efforts. Ultimately, custom dashboards enable organizations to track key metrics efficiently, align performance with business objectives, and foster a culture of data-driven decision-making.
Types of Custom Dashboard Applications
Building on the core components and selection criteria above, custom dashboards manifest differently depending on their intended purpose, audience, and operational context. A key use case is tracking team performance, where dashboards enable organizations to measure and monitor the efficiency and effectiveness of team activities. Selecting the right dashboard type ensures your development process aligns with actual usage patterns.
Executive and Strategic Dashboards
Executive dashboards display data at the highest organizational level, presenting key performance indicators KPIs that inform strategic decision-making. These digital dashboard implementations prioritize clarity over detail, showing business performance trends, revenue trajectories, market positioning, and goal progress.
Typical features include:
- Aggregated financial metrics integrated from accounting and ERP systems
- Quarter-over-quarter and year-over-year comparison visualizations
- Strategic goal tracking with progress indicators
- Mobile-responsive designs for executives accessing insights remotely
The design philosophy emphasizes rapid comprehension—executives should understand organizational status within seconds of viewing the dashboard.
Operational and Real-Time Monitoring Dashboards
Operational dashboards serve frontline managers and teams who need to track metrics continuously throughout workdays. Manufacturing facilities monitor production throughput; logistics companies track real time data from fleet GPS systems; customer service departments watch queue depths and resolution times.
These interactive dashboards incorporate:
- Live data feeds from IoT sensors, transaction systems, and automated processes
- Alert mechanisms triggering notifications when specific metrics breach thresholds
- Department-specific views filtered to show relevant information for each team
- Historical data overlays enabling trend analysis alongside current conditions
Real-time monitoring dashboards often integrate with existing systems through API connections, allowing users to both view and interact with operational data. By leveraging the ability to integrate dashboards with various data sources and tools, organizations enable seamless real-time data flow and comprehensive performance monitoring.
Financial and Analytics Dashboards
Finance teams require dashboards that handle complex data relationships—cash flow projections, budget variance analysis, regulatory compliance tracking, and multi-entity consolidations. Business dashboard development for finance emphasizes accuracy, audit trails, and predictive analytics capabilities.
Advanced implementations incorporate machine learning models for forecasting, anomaly detection in transaction patterns, and automated regulatory report generation. These dashboards pull data from accounting platforms, banking feeds, and ERP financial modules to create comprehensive financial intelligence views.
Industry-Specific Dashboard Solutions
Certain industries demand specialized dashboard approaches:
Healthcare: Patient flow visualization, Electronic Health Records integration, regulatory compliance tracking, and resource utilization monitoring require HIPAA-compliant architectures and clinical workflow understanding.
Transportation and logistics: Route optimization displays, GPS tracking visualization, delivery performance metrics, and fleet maintenance scheduling demand real-time geographic data processing.
Legal services: Case management tracking, billable hours analysis, document workflow visualization, and matter profitability require integration with practice management systems.
Nonprofit organizations: Donor management dashboards, program effectiveness tracking, grant compliance reporting, and fundraising campaign analytics help organizations demonstrate impact to stakeholders.
Selecting appropriate dashboard types based on organizational function creates the foundation for a focused development process. With dashboard types clarified, implementation methodology becomes the critical success factor.
Custom Dashboard Development Process and Implementation
Moving from conceptual dashboard types to working solutions requires systematic execution across multiple phases. Dashboard development services follow structured methodologies to ensure deliverables match business requirements and user expectations.
Discovery and Requirements Gathering
Comprehensive discovery prevents costly mid-project pivots and ensures the finished dashboard addresses actual business needs rather than assumed requirements. This phase establishes the foundation for everything that follows.
Essential discovery activities include:
- Stakeholder interviews identifying business objectives, pain points with current reporting, and specific metrics each role requires
- Data source auditing cataloging all existing systems containing relevant data, documenting connection methods, and assessing data quality
- User persona development defining who will access the dashboard, their technical proficiency levels, and typical workflow patterns
- KPI framework establishment selecting specific metrics aligned with business goals and determining calculation methodologies
- Technical feasibility analysis evaluating integration complexity, security requirements, and infrastructure constraints
Requirements gathering prevents the “beautiful but broken” outcome where visually impressive dashboards fail because underlying data connections were inadequately planned.
Technology Stack Selection and Architecture Planning
Technology decisions significantly impact dashboard performance, scalability, and long-term maintenance costs. The tech stack must align with your existing infrastructure while supporting future growth.
Frontend frameworks determine user experience quality. React, Angular, and Vue.js each offer different strengths for creating responsive, interactive dashboards. Selection depends on existing team expertise, performance requirements, and desired customization depth.
Backend platforms like Node.js, Python with Flask/Django, or .NET handle data processing, API management, and business logic implementation. The choice impacts integration flexibility with your data sources and processing capabilities for large datasets.
Database and data warehouse architecture must accommodate both current volumes and projected growth. Cloud platforms like AWS, Azure, or Google Cloud provide scalable infrastructure, while purpose-built data warehouses optimize query performance for analytics workloads.
Security frameworks implementing OAuth 2.0, SSO integration, data encryption, and role-based access control protect sensitive business data throughout the dashboard ecosystem. With custom dashboard development, data security handled through end-to-end encryption, secure access controls, and compliance with industry standards ensures sensitive data is protected at every stage.
Development Framework Comparison
Choosing between development approaches involves trade-offs between speed, flexibility, and ongoing maintenance requirements:
| Framework | Best For | Integration Strength | Scalability |
|---|---|---|---|
| Power BI Custom Visuals | Microsoft ecosystem environments | Office 365, Azure, Dynamics | Enterprise-ready with licensing |
| React + D3.js | Highly interactive, unique visualizations | REST APIs, GraphQL, any data source | Fully customizable architecture |
| Tableau Embedded | Advanced analytics with rapid deployment | Multiple databases, cloud sources | High performance at scale |
| Full Custom Web Development | Unique requirements, maximum flexibility | Any system, API, or data source | Unlimited customization potential |
Organizations deeply invested in Microsoft infrastructure often find Power BI custom development accelerates deployment while maintaining ecosystem coherence. Teams requiring pixel-perfect control over visualizations or integration with non-standard data sources typically benefit from React-based custom development despite longer timelines.
The agile approach works well for dashboard development, allowing users to review functional increments and provide feedback before full completion. This iterative process reduces the risk of building features users don’t actually need while ensuring the finished product aligns with evolving business priorities.
Data Security Considerations
Ensuring robust data security is a fundamental aspect of custom dashboard development. As dashboards aggregate and display sensitive business data, it is essential to implement comprehensive security measures throughout the development process. Leading dashboard development companies prioritize data encryption, both in transit and at rest, to safeguard information from unauthorized access. Role-based access controls and strong authentication protocols further restrict data visibility to only those users who require it.
Custom dashboards should also be designed with regulatory compliance in mind, adhering to industry standards such as GDPR, HIPAA, or other relevant frameworks. Regular dashboard maintenance, including timely software updates and security patches, is critical to addressing emerging threats and maintaining the integrity of the system. By handling data security proactively, businesses can confidently leverage actionable insights from their dashboards while ensuring that sensitive information remains protected at all times.
Cloud-Based Dashboard Solutions
Cloud-based dashboard solutions have revolutionized the way organizations deploy and manage custom dashboards. By leveraging cloud infrastructure, businesses gain the flexibility to access dashboards from any location and device, supporting remote work and real-time collaboration. Cloud-based dashboard development services also simplify integration with other cloud applications, enabling seamless data flow and unified analytics across the organization.
One of the key advantages of cloud-based dashboards is the reduction in IT overhead. Automatic software updates and maintenance ensure that dashboards remain secure, reliable, and up-to-date without the need for manual intervention. This approach eliminates the need for significant upfront investment in hardware or infrastructure, making custom dashboard development more accessible and cost-effective for businesses of all sizes. As a result, organizations can focus on extracting value from their data while the cloud provider manages the technical complexities.
Data Visualization and Storytelling
The power of a custom dashboard lies in its ability to transform complex data into clear, actionable insights through effective data visualization. By incorporating a range of visualization tools—such as interactive charts, graphs, and maps—businesses can create dashboards that not only display data but also tell a compelling story. Well-designed data visualization enables users to quickly spot trends, uncover patterns, and understand the drivers behind business performance.
Custom dashboard development services should prioritize data visualization expertise, ensuring that dashboards are intuitive and easy to navigate for all users. Advanced features like predictive analytics and machine learning can be integrated to highlight future trends and provide actionable recommendations, further enhancing the value of the dashboard. Interactive dashboards allow users to drill down into specific data points, facilitating deeper analysis and more informed decision-making. By leveraging these capabilities, organizations can turn raw data into a strategic asset that drives growth and innovation.
Best Practices for Dashboard Development
Achieving successful implementation of custom dashboards requires adherence to proven best practices throughout the dashboard development process. Start by clearly defining business objectives and selecting key performance indicators (KPIs) that align with organizational goals. A user-centric approach to dashboard design—featuring intuitive navigation and customizable interfaces—ensures that dashboards are accessible and valuable to all stakeholders.
Scalability and adaptability are essential, as business needs and data sources evolve over time. Partnering with experienced dashboard development services can help ensure that your custom dashboard remains robust, secure, and responsive to changing business requirements. Ongoing dashboard maintenance, regular performance reviews, and user feedback loops are critical for optimizing dashboard performance and ensuring continued relevance.
By following these best practices, businesses can create custom dashboards that deliver actionable insights, support data-driven decision-making, and drive sustained business growth. Continuous improvement and alignment with business priorities will ensure that your dashboard remains a vital tool as your organization evolves.
Common Custom Dashboard Development Challenges and Solutions
Even well-planned dashboard projects encounter obstacles. Anticipating these challenges and preparing mitigation strategies significantly improves project outcomes and ensures successful implementation.
Data Quality and Integration Complexity
Problem: Multiple data sources often contain inconsistent formats, duplicate records, missing values, and conflicting definitions for the same metrics. Connecting legacy systems lacking modern APIs creates additional integration headaches.
Solution: Implement robust ETL processes that validate, cleanse, and standardize data before it reaches visualization layers. Establish clear data governance rules defining how conflicts between sources are resolved. Build error handling that alerts administrators to data quality issues rather than silently displaying incorrect information.
Performance Issues with Large Datasets
Problem: Dashboards querying millions of records can become frustratingly slow, undermining user adoption regardless of how valuable the insights might be. Overall dashboard performance degrades as data volumes grow.
Solution: Optimize database queries through proper indexing, aggregation strategies, and materialized views. Implement caching mechanisms for frequently accessed data. Use progressive loading that displays summary information immediately while detailed data loads in the background. Pre-aggregate historical data at appropriate granularity levels.
User Adoption and Training Resistance
Problem: Even excellent dashboards fail if intended users don’t actually use them. Resistance stems from unfamiliarity, perceived complexity, or disruption to established workflows. Studies indicate that 40% of dashboards go unused due to poor user experience design.
Solution: Involve end users during the design dashboards phase, incorporating their feedback into interface decisions. Provide comprehensive training tailored to different user skill levels, including resources for non technical users. Design intuitive navigation with minimal learning curves and ensure mobile accessibility for users working across various platforms.
Scalability and Maintenance Overhead
Problem: Initial dashboard implementations may work well but degrade as data volumes increase, user counts grow, or business requirements change. Without proper maintenance services, dashboards become outdated and unreliable.
Solution: Build modular architecture using microservices that can be scaled independently. Establish clear dashboard maintenance protocols including regular performance monitoring, security updates, and data source validation. Document system architecture thoroughly to enable ongoing evolution as the dashboard evolves with changing business needs.
Proper planning for these challenges transforms potential project failures into manageable obstacles, allowing organizations to realize the full value of their dashboard investments.
Conclusion and Next Steps
Custom dashboard development transforms scattered business data into unified platforms delivering actionable insights precisely aligned with your organizational requirements. Unlike generic tools, custom dashboard solutions integrate with your existing systems, reflect your specific business processes, and evolve alongside changing business priorities.
Success requires systematic execution: thorough requirements gathering preventing scope misalignment, appropriate technology selection supporting scalability, and proactive challenge mitigation ensuring user adoption.
Immediate next steps:
- Audit current data sources and document integration requirements across all systems containing key data
- Define business objectives the dashboard must support and identify specific metrics for each stakeholder group
- Evaluate existing technology infrastructure and team capabilities to inform development approach decisions
- Engage potential dashboard development company partners to assess their experience with similar implementations
Related topics worth exploring include data warehouse development for organizations needing foundational data infrastructure, business intelligence strategy for broader analytics program planning, and dashboard integration services for organizations connecting new dashboards with existing BI tool environments.
Additional Resources
Development documentation and best practices:
- Power BI custom visual development guides for Microsoft-ecosystem implementations
- D3.js documentation for organizations pursuing custom visualization development
- API integration testing frameworks for validating data source connections
Design and usability guidelines:
- Data visualization principles emphasizing clarity over decoration
- Dashboard design patterns that limit cognitive overload (5-7 key metrics per view)
- WCAG accessibility compliance requirements for enterprise dashboards
Security and compliance frameworks:
- Data encryption standards for protecting sensitive business information
- Role-based access control implementation patterns
- Audit trail requirements for regulated industries
Success measurement:
- Dashboard ROI calculation methodologies
- User adoption tracking metrics
- Performance benchmarking approaches for informed decision making
FAQs Related To Custom Dashboard Development
What is custom dashboard development?
Custom dashboard development is the process of designing, building, and deploying tailored visual interfaces that present key business data in an intuitive, actionable way. These dashboards consolidate data from multiple sources and turn it into charts, KPIs, and insights specific to your goals.
Why invest in custom dashboard development?
Investing in custom dashboard development gives your Team a single source of truth that aligns with your unique business processes. It eliminates static spreadsheets, reduces manual reporting, improves decision-making speed, and provides real-time visibility into performance metrics, often supported by robust Data Management.
What kinds of dashboards can be built with custom dashboard development?
With custom dashboard development, you can build executive overviews, operational dashboards for Cloud Applications, sales and marketing analytics, financial performance views, customer behavior insight dashboards, employee productivity reports, and more — all tailored to specific user needs.
How does custom dashboard development improve business decision-making?
Custom dashboards present complex data in easy-to-interpret Power BI / Visualization formats, enabling stakeholders to spot trends, detect anomalies, and track goals without digging into raw tables. They help teams monitor performance in real time and make data-driven decisions faster.
What technologies are used in custom dashboard development?
Custom dashboard development typically uses data visualization tools and platforms like Power BI, Tableau, Looker, or custom web interfaces built with JavaScript frameworks (e.g., React, D3.js, or Vue.js). These tools connect to your data sources and power interactive and dynamic dashboards.
Can custom dashboard development integrate with my existing data systems?
Yes. A strong custom dashboard development process includes connecting dashboards to your existing databases, APIs, cloud services, and business tools. This ensures live, accurate data flows into your dashboards, often utilizing Multi-Source Data Aggregation without manual export or updates.
How long does custom dashboard development take?
The timeline for custom dashboard development depends on the number of data sources, complexity of metrics, required interactivity, and integration needs. Simple dashboards can be delivered in a few weeks, while enterprise-grade implementations may take longer based on scope and Technology Stack requirements.
What is the typical process for custom dashboard development?
The typical process includes discovery (defining goals and KPIs), data integration planning, architecture design, dashboard prototyping, development, user testing, deployment, and ongoing refinement. Good custom dashboard development includes feedback loops to ensure usability.
How do you ensure the dashboards remain accurate and up to date?
Maintaining accuracy and freshness in custom dashboard development involves automated data pipelines, scheduled refreshes, monitoring alerts for failed loads, and governance to validate Data Management quality so that users always see reliable information.
How do I choose the right custom dashboard development partner?
When choosing a partner for custom dashboard development, look for experience across visualization tools, strong data integration expertise, a clear development process, communication skills, and a track record of delivering dashboards that drive measurable business value, similar to the success seen in our Restaurants (Case Study).