
Real-Time Physical Security Dashboard & Analytics Solutions
We helped a national security company maximize performance and increase profitability through data automation and visualization of real-time Key Performance Indicators.
MOST Programming helped create a culture of accountability and improved profitability for a national security leader. A national security company specializing in Healthcare and Airports initiated a task force with the goal of improving profitability and overall performance through the visualization of data.
Analyzing Real-Time Workforce Trends
With $200 million in revenue, 4,500 employees and more than 220 business units across the United States, the client had a tremendous amount of data generated daily. Not only was the quantity enormous, but the data was in multiple formats from multiple sources, making it difficult to gather and evaluate.
How could the data be properly organized and analyzed to enable informed decision-making and ultimately drive performance improvements and increased profitability?
THE CHALLENGE
Transformed Data Into Performance Improvement
Create a custom data analytic platform consolidating all the disparate data together in real-time.
Assist in identifying and generating the most impactful key performance indicators. Implement easy to understand dashboards to display company-wide data by time frame, business unit, region, or client. Isolate and showcase trends, allowing the client to take action with confidence and stay ahead of the competition.
THE SOLUTION
Established Real-Time Analytics Driving Accountability
The streamlined analytics and comprehensive dashboards enabled real-time visibility into company performance and spurred a new culture of accountability and proactivity. This drove a reduction in overtime, decreased turnover and ultimately improved profitability.
THE RESULT
INTERFACE EXAMPLE


Physical Security Company Analytics & Custom Dashboards: Turning Guard Operations Into Measurable ROI
Introduction: Why Analytics Matter For Physical Security Companies In 2025
Guard services, patrols, and system monitoring have quietly become data-rich operations. Since around 2020, the widespread adoption of mobile patrol apps, cloud-connected access control, and digital incident reporting has generated enormous volumes of timestamped data that most security companies barely touch. In 2025, clients expect more than a guard standing at a post—they expect real-time analytics, dashboards, and clear key performance indicators from their security vendors.
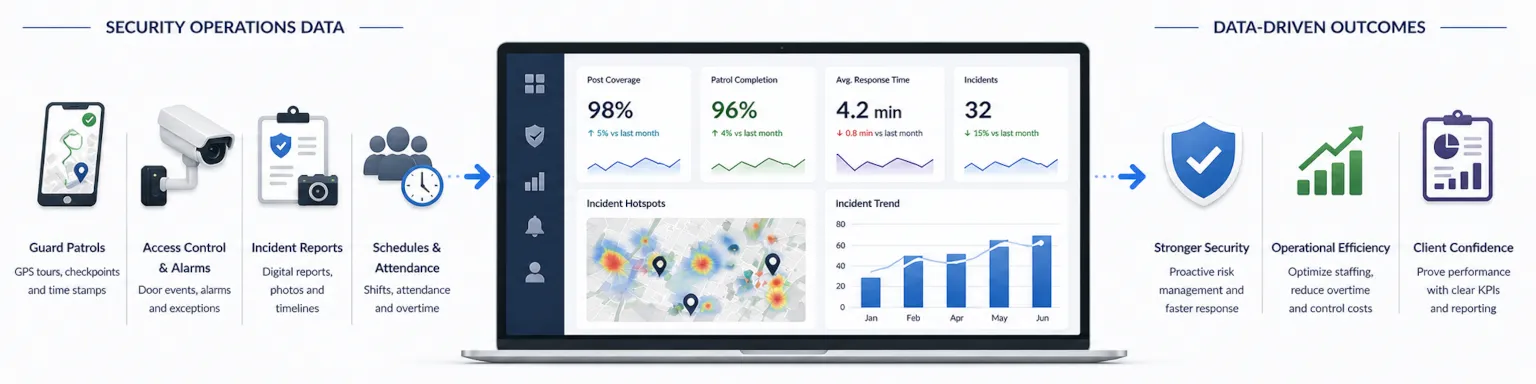
Modern guard tour systems and incident reporting platforms—used by security firms across North America and Europe—now capture GPS tracks, checkpoint scans, photo evidence, and detailed incident timelines automatically. The companies leveraging this data are pulling ahead of competitors still juggling spreadsheets and paper logs. Digital platforms help security companies stay organized by centralizing operational data and streamlining access for staff, making it easier to manage reports and processes efficiently.
This article answers the fundamental questions every security company owner and operations manager should be asking: what should a physical security company measure, how should they measure it, and why does it matter for profitability and client retention? Tracking KPIs is essential for monitoring progress toward strategic goals and improving service quality, ensuring that analytics drive meaningful business outcomes.
Consider this: a multi-site retail client in 2024 reduced shrinkage by 22% after implementing guard performance analytics that identified gaps in patrol coverage during shift changes. That’s the kind of measurable outcome that wins contract renewals and justifies rate increases.
What Is Physical Security Company Analytics?
Physical security company analytics is the practice of collecting, visualizing, and acting on data from guard tours, incident reports, alarms, access control systems, and client SLAs to improve both security outcomes and business performance.
This is broader than AI video analytics alone. While video intelligence is one component, comprehensive analytics for a security company includes:
- Attendance and punctuality tracking for security personnel
- Overtime patterns (billed vs. unbilled)
- Incident timelines and resolution metrics
- Client satisfaction scores and feedback
- Compliance with training requirements and post orders, where analytics can identify gaps and inform personnel training programs to improve employee performance and accountability
- Financial metrics like contract profitability and invoice accuracy
The typical data sources feeding these analytics include:
- Patrol apps: GPS tracks, geofenced clock-ins, checkpoint scans via NFC/RFID or QR codes
- Access control logs: Door events, credential usage patterns, exceptions
- Video management systems: Alarm events, motion triggers, system health status
- Incident and daily activity reports (DARs): Timestamped narratives captured via mobile apps
- Time and attendance systems: Shift schedules, actual hours worked, overtime
- Invoicing and billing platforms: Revenue per contract, payment cycles
- Client feedback surveys: Structured ratings and comments
The 2023–2025 period has seen a clear trend toward digital post orders rather than paper logs. Mid-sized companies with 50–500 security guards began adopting integrated analytics dashboards widely around 2022–2024, largely driven by client RFP requirements that now routinely ask for reporting capabilities and performance metrics.
Benefits Of Analytics For Physical Security Companies
Analytics deliver three core outcomes for contract security firms: improved profitability, higher service quality, and stronger client retention. When you can measure what matters, you can manage it—and prove it to the people paying your invoices.
Operational efficiency
Measuring tour completion rates, overtime patterns, and response times allows schedulers and operations managers to optimize routes and staffing levels. One regional security company in the Midwest reduced unbilled overtime by 14% within a year after deploying automated scheduling that flagged coverage gaps before they became emergency call-ins.
Better risk management
Analyzing incident hotspots and patterns enables a proactive approach rather than reactive dispatch. When a logistics client noticed repeated weekend thefts at specific warehouses in 2023, historical data showed that adding patrols during a specific four-hour window on Saturday nights would address the problem—and it did, reducing incidents by 60% the following quarter.
Stronger client relationships
Using dashboards or monthly analytics reports to prove SLA compliance transforms the conversation with clients. Instead of vague assurances, you can show that your team achieved 98% post coverage in Q3 2024, with average incident response times of 4.2 minutes. That kind of transparency builds trust and justifies rate increases. Consistent attendance and punctuality of security guards, as demonstrated through analytics, are key to building trust with clients by ensuring reliable and dependable security coverage.
Guard accountability and morale
Transparent KPIs tied to attendance, training hours, and incident handling quality create a fair system for recognition, bonuses, and targeted coaching. Guards who know the metrics can see their own performance and understand what good looks like.
Strategic decision-making
Owners and executives can use analytics to determine which contracts are profitable, which sites are loss-making due to overtime or high incident volume, and where to invest in technology (like remote video monitoring) instead of additional manpower. These are the informed decisions that separate growing companies from stagnant ones.
Core KPI Categories For Physical Security Company Analytics
Security leaders should organize metrics into a handful of KPI families instead of tracking dozens of unrelated numbers. A focused approach prevents dashboard overload and ensures the entire team knows which metrics actually matter.
Device and system performance KPIs
These cover uptime of cameras, NVRs, access control panels, and alarm receivers. Camera outages during critical incidents—a recurring problem from 2020–2024—highlight the importance of tracking system health. A camera that’s been offline for three days creates blind spots that may not be discovered until after a theft occurs. Maintaining physical security measures through reliable, well-maintained hardware and systems is fundamental to preventing security breaches and cannot be fully replaced by AI.
Guard operations KPIs
These include attendance reliability, tour completion rates, incident response times, resolution times, and protocol compliance. For contract guarding, these metrics directly reflect service delivery quality and are often the first things clients ask about.
Incident and risk KPIs
Track volume, type, severity, and recurrence of security incidents per site, per shift, and over time. Trending 12-month graphs reveal whether your security measures are actually reducing risk or just maintaining the status quo.
Business and client KPIs
Client satisfaction scores, contract profitability, invoice payment cycles, and SLA adherence percentages belong here. These metrics matter to CFOs and owners making decisions about which contracts to pursue or exit.
Training and compliance KPIs
Training completion by topic—use-of-force refreshers, CPR certification, de-escalation techniques, mandatory training for regulated sectors—ensures compliance and reduces liability. Audit findings for healthcare facilities or critical infrastructure sites often trace back to training gaps that proper tracking would have caught.
Operational KPIs: Measuring Guard And Patrol Performance
This section focuses on field operations metrics that day-to-day supervisors and schedulers care about the most. These are the numbers that determine whether your physical security operations run smoothly or constantly fight problems.
Attendance reliability
Calculate this as shifts attended divided by shifts scheduled in a given month. Platforms with biometric time clocks or geofenced mobile clock-ins automatically track punctuality and no-shows. A guard who clocks in from the parking lot three minutes late every shift creates a different risk profile than one who’s consistently early.
Overtime management
Track billed vs. unbilled overtime per site and per guard. A company in Texas reduced unplanned overtime by 18% in 2023 after deploying automated scheduling that identified chronic understaffing at certain posts before it turned into emergency weekend callbacks.
| Overtime Metric | What It Reveals |
|---|---|
| Billed overtime | Revenue opportunity if properly invoiced |
| Unbilled overtime | Margin erosion and scheduling failures |
| Overtime by guard | Potential burnout or availability issues |
| Overtime by site | Understaffed posts needing attention |
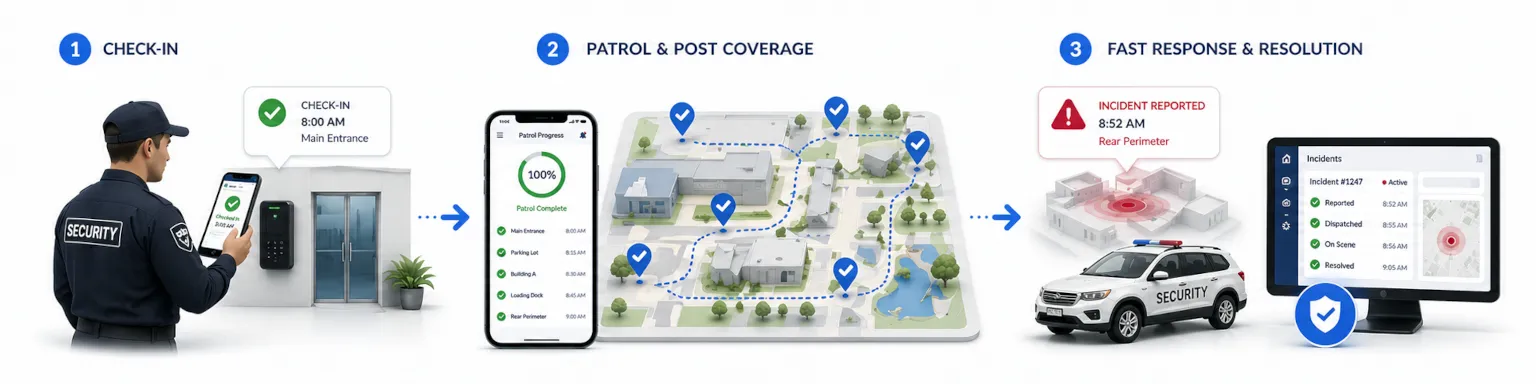
This measures the time from first alert (alarm, client call, app notification) to guard arrival or first action. Benchmarks vary by environment: under 5 minutes is typical for malls and retail, while large industrial campuses may target under 10 minutes.
Incident resolution time
This spans from incident start to completion of documentation and site stabilization. Mobile apps that timestamp each step—arrival, action taken, photos captured, report submitted—create an auditable timeline that supports both internal review and client reporting.
Tour completion rate
Derived from planned versus completed tours, using NFC/RFID tags, QR checkpoints, or GPS verification. Research consistently shows that missed tours correlate with higher incident rates. If a guard skips the loading dock checkpoint three nights in a row, that’s exactly where problems tend to emerge.
Compliance with post orders
Measure how often guards follow required steps—locking doors, checking temperature sensors, verifying fire extinguisher access—based on checklist completion in the patrol app versus supervisory audits. Gaps here represent both security vulnerabilities and potential liability.
Client-facing view
These KPIs should appear in dashboards shared with clients. Weekly or monthly reports showing guard performance at client sites demonstrate accountability and give clients a clear picture of what they’re paying for.
System And Device Analytics For Physical Security Providers
Many guarding companies now deploy and maintain electronic security system, CCTV, access control, alarms—alongside their manned services. Tracking technical performance is essential for comprehensive physical security systems management.
Device uptime and performance
Track percentage uptime per camera, recorder, door controller, and intrusion panel. Since around 2022, critical sites have expected 99%+ uptime SLAs in their contracts. A camera that’s been offline for a week without anyone noticing undermines the entire security posture.
Asset utilization rate
Measure whether installed devices are actively used. If you’ve deployed 200 cameras across 10 sites, how many are actually viewed during live monitoring, pulled for investigations, or feeding analytics? Devices sitting idle or overloaded with false alarms represent wasted investment.
System health check frequency
Scheduled automated health checks—daily pings, weekly storage capacity reviews, monthly firmware status assessments—keep systems reliable. Analytics should highlight overdue checks before they become failures.
Maintenance response time
Track time from fault detection (camera offline alert, door controller error) to first technician action and to final fix. This metric appears in service dashboards for clients and directly impacts their perception of your reliability.
Alarm and analytics tuning metrics
Track false alarm rates from video analytics or intrusion detectors. The ongoing tuning process from 2021–2025 has dramatically reduced nuisance alarms at well-managed sites, improving guard workload and reducing alert fatigue.
Consider implementing color-coded health scores and device maps that give operations managers an at-a-glance view of system health across all client sites.
Incident And Risk Analytics For Physical Security Firms
Incident analytics are central to proving that a security program actually reduces risk over months and years. Without this data, you’re asking clients to trust that their investment is working—rather than showing them proof.
Incident volume and type
Track total security incidents per month by category (theft, trespass, vandalism, workplace violence, safety hazards) and by site. Typical 2023–2024 portfolios spanning logistics, retail, and corporate facilities show distinct patterns that inform resource allocation.
Severity and impact
Score incidents as minor, moderate, or critical based on financial loss, safety impact, and operational disruption. These scores feed into heatmaps for management reports that highlight where attention and resources should flow.
| Severity Level | Criteria | Typical Response |
|---|---|---|
| Minor | No injury, minimal loss (<$500) | Standard documentation |
| Moderate | Minor injury or moderate loss | Supervisor review, client notification |
| Critical | Serious injury, major loss, or media attention | Executive escalation, investigation |
Time-of-day and day-of-week patterns
Dashboards should visualize when most incidents occur. Friday late-night spikes at entertainment venues, Monday morning access control exceptions at corporate sites—these patterns guide staffing decisions and help identify patterns that generic schedules miss.
Location-based trends
Map incidents by building, zone, or GPS cluster. Loading docks, parking lots, and outdoor storage yards typically show higher risk than interior spaces. This granular view enables targeted interventions rather than blanket coverage increases.
Prevention versus reaction
Include metrics showing how improved deterrence—extra patrols, signage, improved lighting—reduces incident counts year-over-year at specific sites. This is the data that proves security investment delivers ROI.
Legal and compliance reports
Detailed, timestamped incident analytics assist with insurance claims, regulatory reporting, and internal investigations. Healthcare and education sectors particularly value comprehensive incident reports that document response protocols were followed.
Business And Client-Focused Analytics For Security Companies
Analytics aren’t just for security operations—they’re essential for running a healthy, profitable business that clients want to renew with year after year.
Client satisfaction scores
Structured surveys or NPS-style ratings collected quarterly provide quantifiable feedback. Since around 2022, leading security companies have correlated these scores with operational KPIs to identify which performance factors most influence client satisfaction.
Contract profitability
Analyze revenue versus direct labor, overtime, equipment costs, and incident-related extra work per contract. Underpriced 24/7 posts are a common culprit when contracts drain resources rather than generate margin.
| Profitability Factor | What to Track |
|---|---|
| Labor cost ratio | Direct wages + benefits as % of contract revenue |
| Overtime impact | Overtime wages as % of total labor cost |
| Incident burden | Hours spent on incident response beyond baseline |
| Equipment costs | Maintenance and replacement expenses per site |
SLA adherence
Track fulfillment of response times, coverage hours, reporting deadlines, and training requirements for each client. Visualize compliance as percentages on a dashboard that clients can access directly.
Invoice and payment analytics
Monitor average days sales outstanding (DSO), dispute frequency, and billing accuracy. Automation has dramatically reduced invoicing errors compared to manual processes common before 2020.
Bid and renewal analytics
Analyze win rates by vertical (retail, manufacturing, healthcare), geography, and price level. This data refines sales strategy and helps identify which types of contracts your company wins—and which to stop pursuing.
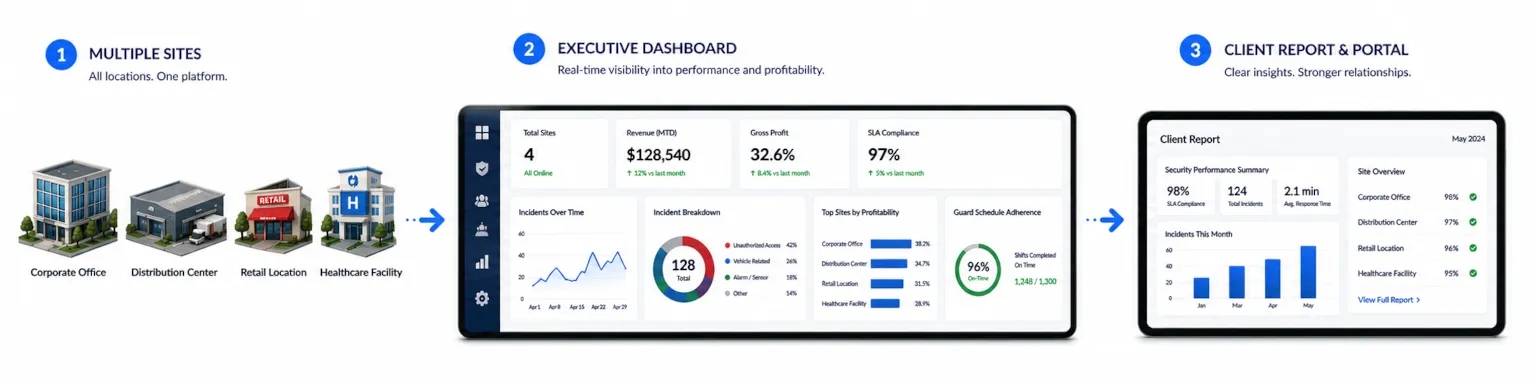
These metrics tie directly to executive-level decisions made by owners and CFOs about company strategy, pricing, and growth.
Physical Security Operations and Compliance
Physical security operations and compliance are foundational to the reputation and effectiveness of any security company. By systematically tracking key performance indicators (KPIs) such as the frequency and type of security incidents, average response times, and system health, security teams gain a clear understanding of how well their physical security operations are performing. These metrics not only help identify potential security risks before they escalate but also ensure that security protocols are being followed consistently across all client sites.
Regularly monitoring KPIs allows security companies to fine-tune their security measures, proactively address vulnerabilities, and demonstrate compliance with both client requirements and industry regulations. For example, tracking the completion of mandatory training and adherence to post orders ensures that all personnel are prepared to respond effectively to incidents and that operations remain compliant with legal and contractual obligations.
Routine audits and assessments are essential for maintaining high standards in physical security. By reviewing operational data and comparing it against established benchmarks, security companies can identify gaps in their security protocols and implement targeted improvements. This continuous improvement approach not only enhances the safety of clients and personnel but also strengthens the company’s position in a competitive market by proving a commitment to best practices and regulatory compliance.
Security Company Finances and Invoicing
Strong financial management is a cornerstone of a successful security company. Leveraging key performance indicators (KPIs) such as revenue growth, profit margins, and client retention rate enables security companies to track their financial health and make informed decisions that drive sustainable growth. By analyzing these metrics, companies can identify which contracts are most profitable, where operational costs can be reduced, and how to optimize resource allocation for maximum efficiency.
Streamlining invoicing and billing processes through automation and integrated platforms reduces administrative errors, accelerates payment cycles, and minimizes disputes. This not only improves cash flow but also enhances customer satisfaction by providing clear, accurate, and timely invoices. Data-driven insights from financial analytics empower security companies to refine their pricing strategies, adjust service offerings, and respond quickly to market changes.
By continuously tracking financial KPIs and leveraging technology to automate routine tasks, security companies can focus more on delivering high-quality services and less on manual paperwork. This approach not only supports better decision-making but also helps build long-term client relationships, as clients appreciate transparency, reliability, and the ability to access financial data related to their contracts at any time.
Client Web Portal and Communication
A robust client web portal is a game-changer for modern security companies, transforming the way they communicate and collaborate with clients. By providing a secure, user-friendly platform, security companies enable clients to access valuable insights into their security operations, track progress on key performance indicators, and review incident reports in real time. This level of transparency builds trust and demonstrates a commitment to proactive service delivery.
Through the client web portal, clients can easily access sensitive data, monitor ongoing security incidents, and receive timely updates on potential security threats. This not only enhances client satisfaction but also empowers clients to make informed decisions about their own risk management strategies. Regular, data-driven communication via the portal ensures that clients are always in the loop, reducing the need for back-and-forth emails and manual report sharing.
By leveraging the client web portal, security companies can respond effectively to incidents, provide comprehensive reporting, and showcase the value of their services. This digital approach to client communication not only improves operational efficiency but also strengthens client retention by delivering a seamless, transparent, and responsive experience that sets the company apart from competitors.
Building Effective Security Dashboards For Physical Security Operations
Dashboards are the primary way managers and clients consume analytics. They must be role-specific rather than one-size-fits-all—an operations director needs different data than a client facilities manager.
Command-and-control dashboards
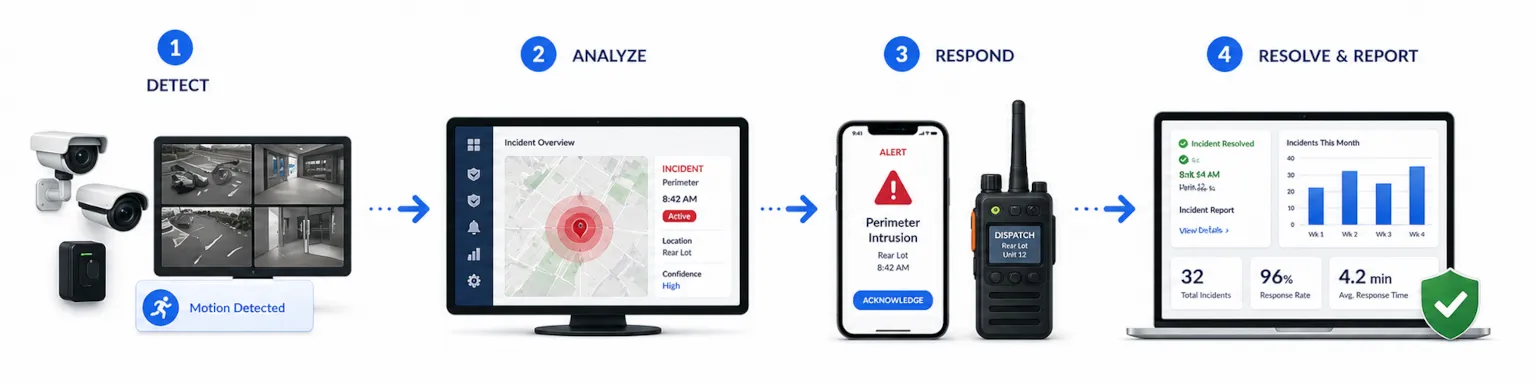
These combine live cameras, access control events, alarms, and guard GPS locations on a map to support real-time decisions in an operations center. The goal is situational awareness: what’s happening right now across all sites?
KPI dashboards for management
High-level tiles showing incident counts, response times, guard availability, overtime percentages, and device health work best for daily or weekly review by operations directors. These dashboards answer the question: are we meeting our standards?
Client-facing dashboards and portals
Secure web portals and mobile apps let clients see tours, incident reports, invoices, and site performance analytics without emailing PDFs back and forth. This self-service model improves transparency and reduces administrative burden on your team.
Design and usability best practices
- Limit each dashboard to 6–10 widgets maximum
- Use clear labels and traffic-light color codes (green/yellow/red)
- Avoid dense tables of numbers in favor of charts and gauges
- Ensure mobile responsiveness for on-the-go access
Data access and permissions
By 2024, most platforms support role-based access so clients, supervisors, and executives see different data. This protects sensitive data and operational security while providing each stakeholder with a comprehensive view relevant to their role.
Data Sources, Integration, And Data Quality
Meaningful analytics require clean, consistent data from multiple sources that historically were siloed in the security industry. Breaking down these silos is essential for a holistic view of performance.
Systems to integrate
Typical integration projects started between 2021 and 2024 connect:
- Guard tour and patrol apps
- Access control platforms
- Video management systems
- HR and timekeeping systems
- Payroll software
- CRM and client management tools
- Ticketing and work order systems
Unique identifiers matter
Sites, posts, guards, and clients each need consistent identifiers across systems. Without this, you can’t match a guard’s time records to their patrol completion rates to their incident handling—and your reports become unreliable.
Common data quality issues
- Incomplete incident reports missing key details
- Missing GPS points from poor cellular coverage
- Guards selecting wrong incident categories
- Devices incorrectly labeled or not mapped to sites
- Duplicate records from system sync errors
Practical data governance steps
- Standardized report templates with mandatory fields
- Required fields in mobile apps that can’t be skipped
- Periodic data audits comparing systems
- Supervisor reviews of important data before it flows to client reports
Getting data right takes ongoing effort, but it’s the foundation that makes everything else work.
Advanced Analytics: From Descriptive To Predictive Security
Descriptive analytics tell you what happened. Predictive and prescriptive analytics tell you what’s likely to happen and what to do about it. This is where physical security analytics mature beyond basic reporting.
Predictive incident modeling
Using historical incidents from 2019–2024, security companies can identify patterns by time of day, weather conditions, local events (sporting events, concerts), and seasonal factors. A warehouse that sees increased theft attempts during holiday shipping season can staff accordingly.
Guard workload forecasting
Historical schedules and incident volumes predict staffing needs for future weeks or seasons. This helps avoid last-minute overtime and shortages while ensuring coverage matches actual demand.
Proactive maintenance analytics
Forecasting which devices are likely to fail based on past failure rates, age, and environmental conditions allows technicians to replace equipment before critical security events rather than after.
AI and machine learning applications
AI-driven video analytics—object detection, intrusion detection, behavior analysis—can feed into dashboards and trigger alerts. However, these systems must be validated to avoid bias and false positives that create alert fatigue and erode trust.
Ethical and privacy considerations
Compliance with privacy regulations (GDPR in the EU, CCPA in California, and other state laws) is non-negotiable when using surveillance and people-related analytics. Internal policies should clearly define data retention, access controls, and acceptable use.
Implementing An Analytics Program In A Physical Security Company
This section provides a practical roadmap for companies starting analytics from scratch or upgrading beyond spreadsheets in 2025.
Step 1: Define objectives
Before selecting tools, choose 5–10 priority questions you need answered:
- Which contracts lose money?
- Where are we missing tours?
- How fast do we respond effectively to incidents?
- Which sites have the highest incident rates?
- Are we meeting SLA requirements?
Step 2: Inventory data and tools
Perform a quick audit of existing patrol apps, VMS, access control, HR, and finance systems. What data is already available? What’s the quality? What gaps exist?
Step 3: Choose a platform approach
Options include:
- Specialized security management platforms with built-in analytics
- Business intelligence tools (Power BI, Tableau) connected via APIs
- Vendor-built analytics modules for specific systems
- Custom dashboards built on one platform aggregating multiple data feeds
Step 4: Build initial dashboards and reports
Start with a minimal set of KPIs: attendance, incident volume, response times, device uptime, overtime. Iterate over Q1–Q2 based on feedback from supervisors and clients.
Step 5: Train staff and clients
Onboard supervisors and control room operators to use dashboards daily. Teach clients how to read and interpret the data so they can self-serve rather than waiting for monthly PDF reports.
Step 6: Review and refine
Schedule quarterly reviews to adjust KPIs, retire unused reports, and add new metrics aligned with evolving client requirements and regulations. Analytics programs that don’t evolve become stale and ignored.
Challenges And Best Practices In Security Analytics
Small and mid-sized security firms face real obstacles when rolling out analytics: limited IT resources, legacy systems, and resistance to change. Acknowledging these challenges is the first step to overcoming them.
Change management
Guards and supervisors may worry about “being monitored.” Frame analytics as a tool for fairness, safety, and recognition—not surveillance. When guards see that good performance gets noticed and rewarded, resistance decreases.
Cost and ROI justification
Build a simple business case with concrete before/after scenarios:
- Reduced overtime from better scheduling
- Lower incident rates from data-driven patrol optimization
- Higher client retention rate from transparent reporting
- Fewer billing disputes from accurate, automated invoicing
Companies that implemented analytics in 2022–2024 typically saw ROI within 12–18 months.
Data security and privacy
Secure analytics platforms with multi-factor authentication, role-based access, and encryption for data in transit and at rest. You’re handling sensitive data about client sites, guard performance, and security events—treat it accordingly.
Standardization of definitions
Agree on what counts as an “incident,” “response,” and “resolution” across all sites and clients. Without standard definitions, metrics from different sites become meaningless comparisons.
Continuous improvement mindset
The best analytics programs evolve. A company that started with basic KPIs in 2023 might, by 2025, have integrated, automated dashboards updated in near real-time. Start where you are and improve efficiency incrementally.
Conclusion: Turning Data Into A Competitive Advantage
Physical security company analytics tie together guard performance, system health, security incidents, and business outcomes into a single, actionable picture. When you can see everything on one platform—from tour completion rates to contract profitability to device uptime—you stop reacting and start managing strategically.
In 2025 and beyond, clients increasingly choose vendors who can prove value and risk reduction with hard data, not just narratives. The security company that shows a 15% reduction in incidents over 12 months wins the renewal over the one that says “we’re doing a great job, trust us.”
Start small but deliberate: select a handful of key KPIs, implement simple dashboards, and expand as your team and clients grow comfortable with data driven decisions. Track what matters, review it regularly, and let the numbers guide your continuous improvement efforts.
Over the next 3–5 years, analytics, AI, and integrated platforms will become standard in the contract security industry. The companies building these capabilities now will have a significant competitive advantage. Those still keeping track of performance on paper will find themselves left behind by security teams who proactively address potential risks with real time data and deliver valuable insights their clients can actually use.
FAQs Related To Physical Security Company Dashboards and Physical Security Analytics
What is a physical security company dashboard?
A physical security company dashboard is a centralized, visual interface that consolidates key performance indicators (KPIs) and operational data from various sources into a single, easy-to-understand view. It provides real-time insights into guard patrols, incident reports, alarm events, and workforce management. This allows managers to monitor performance, identify trends, and make informed decisions quickly. A well-designed dashboard is a critical component of modern physical security analytics.
How can physical security analytics improve profitability?
Physical security analytics improves profitability by identifying operational inefficiencies and areas for cost savings. For example, by analyzing overtime patterns, a company can optimize scheduling to reduce labor costs. Analytics can also pinpoint high-risk areas, allowing for proactive resource allocation and potentially preventing costly incidents. Furthermore, by demonstrating value through data, such as reduced incident response times, you can strengthen client relationships and justify rate increases.
What data sources are used for a physical security company dashboard?
A comprehensive physical security company dashboard pulls data from multiple sources to provide a holistic view of operations. Common data sources include guard tour management systems (for patrol data), incident reporting software, access control systems, GPS tracking, and time and attendance software. Integrating these disparate data sources is a key challenge that our Data Management and Optimization services are designed to solve.
What are the key metrics to track in physical security analytics?
Effective physical security analytics focuses on metrics that directly impact performance and profitability. Key metrics to track include guard attendance and punctuality, patrol completion rates, incident response and resolution times, overtime hours, and client satisfaction scores. By monitoring these KPIs, a physical security company can ensure service level agreement (SLA) compliance and drive a culture of accountability.
How does a physical security company dashboard enhance client relationships?
A physical security company dashboard enhances client relationships by providing transparency and demonstrating value. By sharing customized reports and dashboards, you can prove that you are meeting your contractual obligations and proactively addressing potential issues. This data-driven approach builds trust and transforms conversations from being about cost to being about the value and ROI you provide, which is a core principle of our Data Visualization services.
What is the role of real-time data in physical security analytics?
Real-time data is crucial for proactive security management. With real-time physical security analytics, supervisors can immediately be alerted to missed patrols, delayed responses, or emerging incidents. This allows for immediate intervention, rather than finding out about a problem hours or days later. This real-time capability is powered by a robust Data Flow Architecture that ensures a constant stream of up-to-date information.
How can a smaller security company get started with physical security analytics?
Smaller security companies can start with physical security analytics by first identifying their most critical operational challenges, whether it's managing overtime, improving patrol reliability, or reducing incident response times. The next step is to leverage modern guard management software that has built-in reporting capabilities. For more advanced insights, partnering with a data analytics firm can help you build a custom physical security company dashboard that scales with your business.
Can physical security analytics predict where incidents are likely to occur?
Yes, predictive analytics is an emerging and powerful aspect of physical security analytics. By analyzing historical incident data, including time, location, and type of incident, machine learning models can identify patterns and predict where and when future incidents are most likely to occur. This allows for the proactive deployment of resources to deter crime and mitigate risks, a service that is part of our AI and Machine Learning offerings.
How is data from a physical security company dashboard visualized?
Data in a physical security company dashboard is typically visualized using a variety of charts, graphs, and maps. For example, a map view might show the real-time location of all on-duty guards, while a bar chart could display incident types by location. Key performance indicators are often displayed as gauges or scorecards for at-a-glance understanding. These visualizations are designed to be intuitive and easy to interpret for non-technical users.
What is the ROI of investing in a physical security company dashboard?
The return on investment (ROI) from a physical security company dashboard comes from multiple areas. This includes cost savings from reduced overtime and more efficient resource allocation, improved client retention through greater transparency and proven performance, and the ability to win new business by offering advanced analytics as a key differentiator. Ultimately, a dashboard transforms your operational data into a strategic asset that drives measurable business growth.